🔍 Executive Summary
- An analysis of how a 5MB monitoring tool is disrupting the 'bloated' enterprise software market by providing high-fidelity metrics with near-zero overhead, essential for modern microservices and edge computing.
Strategic Deep-Dive
The Rise of the ‘Lean’ Observability Stack
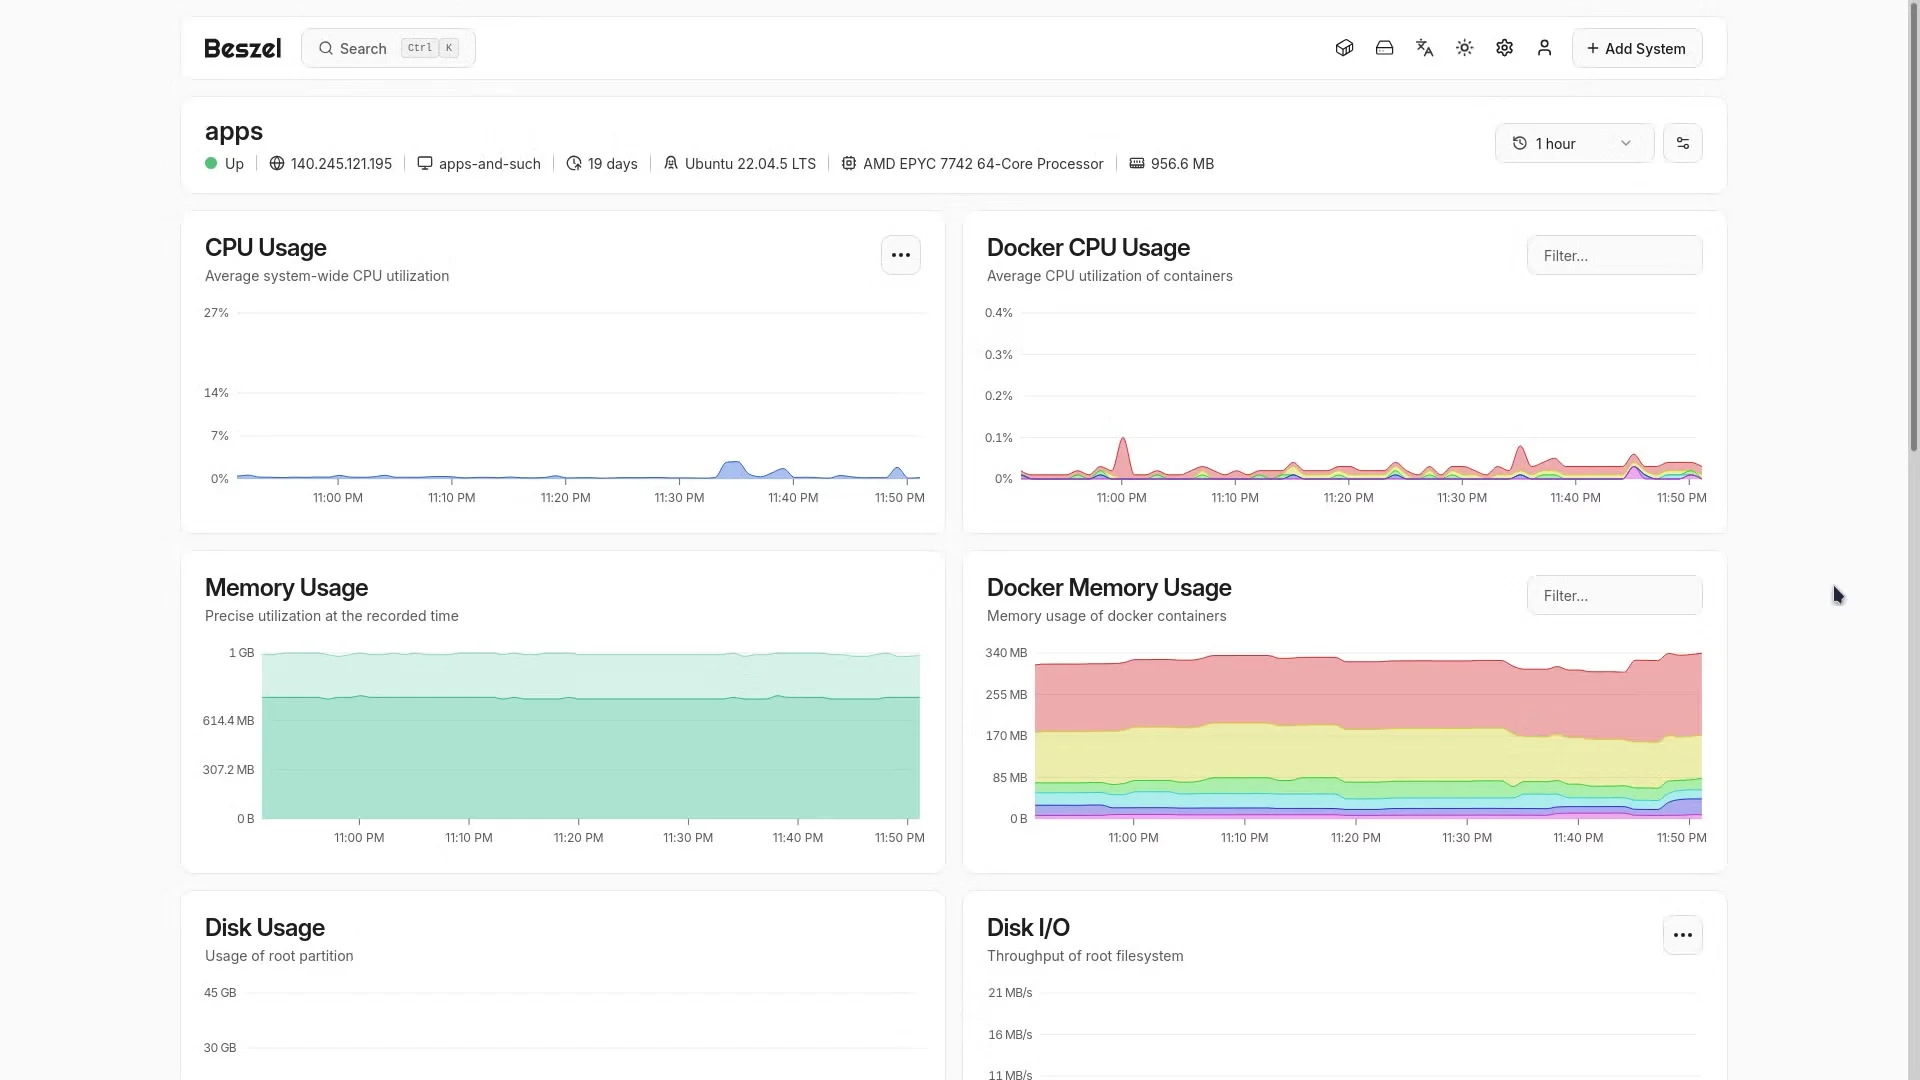
In the era of hyper-scale cloud environments, server monitoring has paradoxically become one of the primary consumers of the very resources it is supposed to optimize. As a Data Systems Analyst, I have frequently observed enterprise monitoring agents consuming upwards of 150MB to 200MB of resident set size (RSS) memory per node. This ‘monitoring tax’ is increasingly unacceptable.
The emergence of a high-performance 5MB monitoring tool represents a critical shift back toward systems engineering fundamentals: achieving maximum visibility with minimum footprint.
Quantitative Analysis of Resource Overhead
From a technical perspective, the efficiency of a 5MB binary is not merely a matter of storage convenience. It is about reducing the ‘observer effect’ in system telemetry. In high-density Kubernetes clusters, resource contention between the application and the monitoring agent can skew P99 latency metrics.
A lightweight 5MB agent typically maintains a negligible CPU ceiling and memory footprint, ensuring that the performance data collected is a true reflection of the workload, not an artifact of the monitoring process itself.
Consider the math for a cluster of 1,000 nodes. Replacing a traditional 150MB agent with a 5MB alternative reclaims 145GB of cluster-wide memory. At standard cloud pricing, this overhead reduction translates directly into thousands of dollars in monthly OPEX savings.
For systems analysts, this allows for higher consolidation ratios—fitting more production pods onto the same hardware without sacrificing observability.
Technical Review: Performance Isolation and Edge Deployment
These lightweight tools are often written in systems languages like Go or Rust, compiled to a single static binary with no external dependencies. This architecture is ideal for diverse environments, from legacy bare-metal servers to the most restrictive scratch-based container images. By focusing on core metrics—cgroups performance, disk I/O wait times, and socket transitions—these tools avoid the ‘feature creep’ that degrades the stability of larger monitoring suites.
Furthermore, in the burgeoning field of edge computing, where devices may only have 512MB of total RAM, a 5MB monitor is not just a luxury; it is a necessity. The ability to track system services and container health in such constrained environments allows for centralized management of distributed networks that were previously ‘dark.’ As we move toward 2026, the industry is recognizing that in the world of telemetry, ’less is more’ is not just a design philosophy—it is an economic and technical imperative for sustainable data systems.